







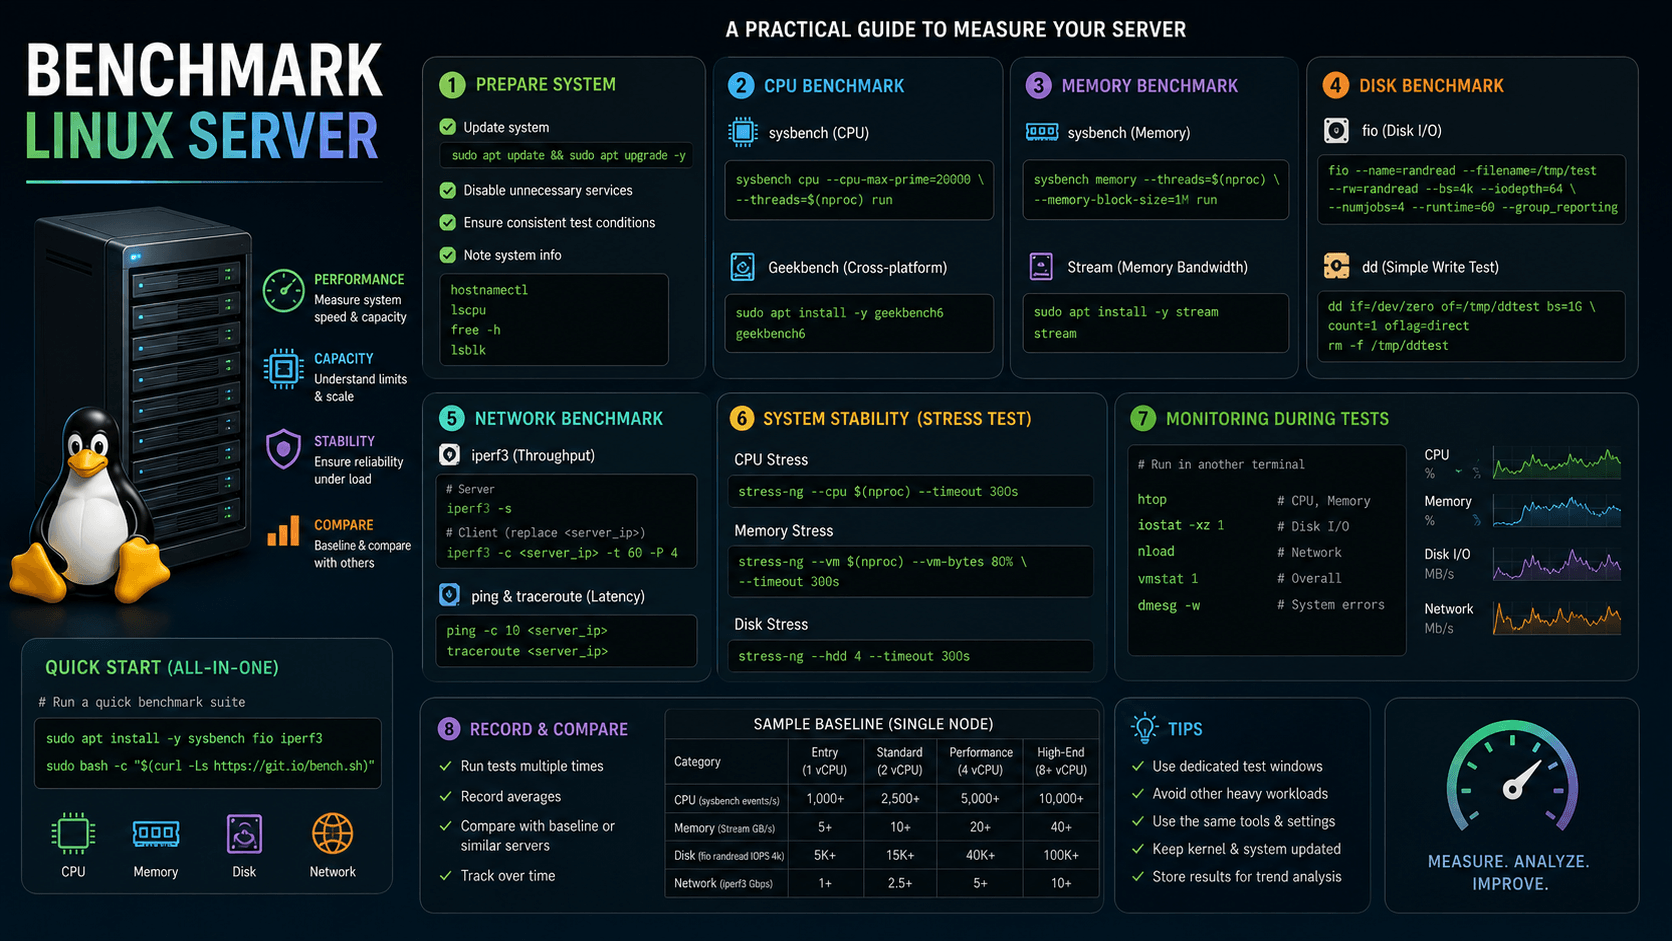
How to Benchmark Linux/Debian/Ubuntu Server
Benchmarking a Linux server sounds simple at first: run a few commands, look at the numbers, and decide whether the machine is fast.
In practice, it is rarely that simple.
A server can have a powerful CPU but slow storage. An NVMe drive can advertise impressive throughput but suffer badly under random I/O. A 10 Gbps network interface might negotiate correctly while packet loss, CPU limits, or a virtualized network stack prevent you from getting anywhere close to line speed.
A useful benchmark therefore needs to answer a few different questions:
- How fast is the CPU?
- Can the CPU sustain that performance under load?
- How much memory bandwidth is available?
- Is the memory stable?
- What IOPS and latency can the storage actually deliver?
- How much network throughput can the server sustain?
- Is the system thermal-throttling?
- Does performance stay consistent during longer workloads?
This guide provides a practical set of Linux benchmarking commands for Debian and Ubuntu servers, with enough context to understand what each test is actually telling you.
Heavy benchmarks can consume all available CPU, RAM, disk I/O, or network bandwidth. Run them during a maintenance window or on a dedicated test system whenever possible.
Before You Benchmark Anything
The first rule of benchmarking is simple:
Record what you are benchmarking.
A result such as:
45000 events/secdoes not mean much by itself.
Was the server using:
Intel Xeon
AMD EPYC
4 vCPU cloud VM
32-core bare-metal server
performance CPU governor
power-saving CPU governor
SATA SSD
NVMe SSD
network-backed storage
Without that context, comparing benchmark results later becomes difficult.
Start by collecting some basic information.
uname -a
lscpu
free -h
lsblk -o NAME,SIZE,TYPE,FSTYPE,MOUNTPOINTS,MODEL
ip addr
You should also check whether the machine is already busy.
uptimeor:
topIf load is already high, benchmark results may reflect current workloads rather than the actual capability of the server.
Install the Benchmarking Tools
Most of the tools used in this guide are available directly from Debian or Ubuntu repositories.
Start with:
sudo apt updateThen install the main benchmarking utilities:
sudo apt install -y \
    sysbench \
    stress-ng \
    openssl \
    fio \
    iperf3 \
    speedtest-cli \
    mtr-tiny \
    ethtool \
    net-tools \
    hdparm \
    smartmontools \
    memtester \
    stressapptest \
    s-tui
A few additional monitoring tools are also useful:
sudo apt install -y \
    sysstat \
    netperf \
    nuttcp \
    ifstat \
    pktstat \
    lm-sensors
You do not necessarily need every package for every benchmark. Think of this as a general Linux performance toolkit.
Start With the CPU
CPU benchmarking is usually the easiest place to begin.
One of the simplest tools is sysbench.
Run:
sysbench cpu \
    --cpu-max-prime=20000 \
    --threads=$(nproc) \
    run
$(nproc) automatically uses the number of logical processors available to Linux.
The output contains several values, but one of the easiest to compare is:
events per secondWhen you repeat the exact same test configuration, a higher number generally indicates better CPU throughput.
The important part is exact same configuration.
Comparing:
--cpu-max-prime=20000against:
--cpu-max-prime=50000is not a meaningful direct comparison.
Single-Core Performance Matters Too
Modern servers often have many CPU cores, but plenty of workloads still depend heavily on individual thread performance.
That includes parts of:
- Web applications
- Databases
- Game servers
- Build processes
- Legacy applications
- Some scripting workloads
Run a single-thread benchmark with:
sysbench cpu \
    --cpu-max-prime=20000 \
    --threads=1 \
    run
Then compare it with the all-core result:
sysbench cpu \
    --cpu-max-prime=20000 \
    --threads=$(nproc) \
    run
This gives you two useful numbers:
Single-thread performance
Multi-thread performance
A CPU with many slower cores may win the multi-thread benchmark while losing badly in single-thread performance.
Short Benchmarks Can Hide Thermal Problems
A CPU might perform very well for 20 seconds and then slow down after five minutes because of heat or power limits.
That is where stress-ng becomes useful.
Run:
sudo stress-ng \
    --cpu 0 \
    --cpu-method matrixprod \
    --timeout 5m \
    --metrics-brief
Here:
--cpu 0means use all available CPUs.
This is less about producing a simple score and more about seeing whether the system stays stable under sustained load.
While it is running, monitor temperatures.
If lm-sensors is available:
watch -n 1 sensorsYou can also watch CPU frequency:
watch -n 1 "grep 'cpu MHz' /proc/cpuinfo"If frequencies suddenly fall while temperatures rise, you may be seeing thermal throttling.
If frequencies stay low even while temperatures are fine, look at:
- BIOS power settings
- Hypervisor limits
- CPU governor
- Cloud instance throttling
- Power limits
s-tui Makes Thermal Testing Much Easier
For a more visual terminal interface:
s-tuiIt can show CPU:
- Temperature
- Utilization
- Frequency
- Load behavior
Running s-tui in one terminal while stress-ng runs in another is a simple way to see whether the machine can maintain its advertised performance.
Crypto Performance with OpenSSL
If the server will handle HTTPS, VPNs, TLS termination, or encrypted traffic, cryptographic performance may matter.
OpenSSL includes a useful benchmark:
openssl speed \
    -multi $(nproc) \
    aes-256-gcm \
    rsa4096
AES-256-GCM is relevant for modern encrypted network workloads.
RSA performance is more useful for asymmetric crypto operations such as signing and verification.
You can test them individually:
openssl speed -multi $(nproc) aes-256-gcmand:
openssl speed -multi $(nproc) rsa4096Modern CPUs with hardware cryptographic acceleration can perform dramatically better than older processors in AES workloads.
Memory Performance Is More Than Just RAM Size
A machine with 128 GB of RAM is not automatically faster than one with 64 GB.
Memory performance also depends on:
- Memory speed
- Channel count
- NUMA layout
- CPU architecture
- Hypervisor configuration
- Memory overcommit
sysbench provides a simple memory throughput benchmark.
sysbench memory \
    --threads=$(nproc) \
    --memory-block-size=1M \
    --memory-total-size=100G \
    run
Look for throughput reported in values such as:
MiB/secYou can explicitly test writes:
sysbench memory \
    --memory-oper=write \
    --memory-block-size=1M \
    --memory-total-size=100G \
    --threads=$(nproc) \
    run
Or reads:
sysbench memory \
    --memory-oper=read \
    --memory-block-size=1M \
    --memory-total-size=100G \
    --threads=$(nproc) \
    run
The exact options available can depend on your installed sysbench version, so verify with:
sysbench memory helpif something behaves differently.
Testing Memory Stability
Throughput tells you how fast RAM is.
It does not tell you whether the memory is reliable.
For a stability test, memtester is useful.
For example:
sudo memtester 8G 1This means:
Test 8 GB
Run one pass
Do not allocate all available RAM.
Check first:
free -hLinux and running applications still need memory while the test is running.
Stressing Memory Allocation
Another useful test is:
sudo stress-ng \
    --vm 4 \
    --vm-bytes 75% \
    --timeout 10m \
    --metrics-brief
This repeatedly exercises memory allocation and virtual memory activity.
It can expose issues that a simple bandwidth benchmark does not show, especially on:
- Virtual machines
- Memory-overcommitted hosts
- NUMA systems
- New hardware
Storage Benchmarking Is Where Things Get Interesting
Storage performance is often misunderstood.
A disk can have excellent sequential throughput while being terrible for databases.
For example:
Sequential read: 3 GB/slooks excellent.
But if the same device performs badly at:
4K random readit might still perform poorly for:
- Databases
- VM disks
- Container storage
- Mail servers
- Metadata-heavy workloads
That is why fio is one of the most important tools in this guide.
First Rule of fio: Know What You Are Writing To
Whenever possible, benchmark using a test file:
/mnt/testfilerather than a raw production device such as:
/dev/sda
/dev/nvme0n1
A write benchmark against the wrong raw device can destroy the filesystem.
Check your storage layout first:
lsblkA Practical Mixed fio Test
A useful mixed read/write test is:
fio \
    --name=randrw \
    --filename=/mnt/testfile \
    --size=10G \
    --bs=64k \
    --rw=randrw \
    --rwmixread=70 \
    --ioengine=libaio \
    --direct=1 \
    --numjobs=4 \
    --runtime=120 \
    --time_based \
    --group_reporting
This workload is roughly:
70% reads
30% writes
64 KiB blocks
4 workers
120 seconds
Pay attention to:
- IOPS
- Bandwidth
- Average latency
- p95 latency
- p99 latency
For many real systems, latency matters more than maximum throughput.
Test Sequential Reads
For large-file workloads:
fio \
    --name=seqread \
    --filename=/mnt/testfile \
    --size=10G \
    --bs=1M \
    --rw=read \
    --ioengine=libaio \
    --direct=1 \
    --numjobs=1 \
    --runtime=120 \
    --time_based \
    --group_reporting
This is closer to workloads such as:
- Backups
- Media streaming
- Large file copies
- Database scans
Test Sequential Writes
fio \
    --name=seqwrite \
    --filename=/mnt/testfile \
    --size=10G \
    --bs=1M \
    --rw=write \
    --ioengine=libaio \
    --direct=1 \
    --numjobs=1 \
    --runtime=120 \
    --time_based \
    --group_reporting
This gives you a better picture of sustained write throughput.
4K Random I/O Is Important for Databases and VMs
A common random-read test is:
fio \
    --name=randread \
    --filename=/mnt/testfile \
    --size=10G \
    --bs=4k \
    --rw=randread \
    --ioengine=libaio \
    --direct=1 \
    --iodepth=32 \
    --numjobs=4 \
    --runtime=120 \
    --time_based \
    --group_reporting
For random writes:
fio \
    --name=randwrite \
    --filename=/mnt/testfile \
    --size=10G \
    --bs=4k \
    --rw=randwrite \
    --ioengine=libaio \
    --direct=1 \
    --iodepth=32 \
    --numjobs=4 \
    --runtime=120 \
    --time_based \
    --group_reporting
Random writes are much harder on storage than sequential workloads and can generate substantial SSD wear, so avoid unnecessary repeated write testing on production devices.
dd Is Fine for a Quick Sanity Check
Sometimes you do not need a full fio run.
You just want to know whether storage is obviously slow.
A quick direct-write test is:
dd \
    if=/dev/zero \
    of=/mnt/testfile \
    bs=1G \
    count=4 \
    oflag=direct \
    status=progress
Then remove the file:
rm -f /mnt/testfileThis gives you a rough write-throughput number.
It does not tell you much about:
- IOPS
- Random I/O
- Queue behavior
- Latency
- Mixed workloads
For serious comparisons, use fio.
Quick Read Testing with hdparm
For a simple read benchmark:
sudo hdparm -Tt /dev/sdaYou will typically see two results.
-T measures cached reads and is heavily influenced by memory and cache behavior.
-t measures buffered reads from the device.
This makes hdparm useful for a quick check, but again, it is not a replacement for fio.
Check Disk Health Before Blaming Performance
Sometimes a slow disk is not just slow.
It may actually be failing.
Check SMART information:
sudo smartctl -a /dev/sdaOr a shorter health check:
sudo smartctl -H /dev/sdaPay attention to indicators such as:
- Reallocated sectors
- Pending sectors
- Media errors
- Temperature
- NVMe wear
- Power-on hours
A benchmark is not very useful if the device is already reporting hardware errors.
Watch Storage While fio Runs
Install sysstat if needed:
sudo apt install sysstatThen run:
iostat -xz 1This lets you watch the storage device in real time.
Fields worth watching include:
r/s
w/s
rkB/s
wkB/s
await
aqu-sz
%util
If await becomes very high while %util stays near saturation, your workload is probably hitting the storage limit.
Network Benchmarking: Do Not Use Internet Speed Tests for Everything
Internet speed tests answer one question:
How fast is my connection to a remote internet test server?
They do not accurately answer:
How fast is the network between these two servers?
For server-to-server benchmarking, use iperf3.
Start an iperf3 Server
On one machine:
iperf3 -sBy default it listens on TCP port:
5201Connect From Another Server
Run:
iperf3 -c server-ipFor example:
iperf3 -c 192.168.10.20That gives you a straightforward TCP throughput test.
Use Multiple Streams on Faster Networks
A single TCP connection may not always saturate a fast network.
Try:
iperf3 \
    -c server-ip \
    -P 4 \
    -t 120
-P 4 creates four parallel streams.
This is especially useful when testing:
- 10 Gbps links
- High-latency networks
- Virtualized networking
- WAN connections
Always Test Both Directions
Network performance is often asymmetric.
Run forward:
iperf3 -c server-ip -P 4 -t 60Then reverse:
iperf3 -c server-ip -P 4 -t 60 -RIf one direction performs much worse than the other, investigate:
- NIC offloading
- Switch configuration
- Firewall rules
- Virtual switch configuration
- Routing
- CPU bottlenecks
UDP Testing Shows Jitter and Loss
For real-time workloads such as:
- VoIP
- WebRTC
- Video streaming
- Game traffic
UDP performance can matter more than TCP throughput.
Run:
iperf3 \
    -c server-ip \
    -u \
    -b 100M \
    -t 60
Look at:
- Packet loss
- Jitter
- Achieved bandwidth
Increase -b carefully until you reach the network's practical limit.
Test Internet Bandwidth Separately
If you installed Debian's speedtest-cli package:
speedtest-cliThere is also a different Ookla CLI commonly named:
speedtestThey are not the same tool and their command-line options differ.
Check what exists:
command -v speedtest
command -v speedtest-cli
Use internet speed tests for WAN validation, not for measuring your internal LAN capability.
Latency Often Matters More Than Bandwidth
A connection can have:
1 Gbps bandwidthand still feel slow if latency or packet loss is poor.
Start with:
ping -c 20 server-ipLook at:
packet loss
minimum latency
average latency
maximum latency
mdev
For a better path-level picture:
mtr -rwz server-ipmtr combines the ideas behind ping and traceroute.
It is particularly useful for detecting:
- Packet loss
- Bad routing
- Unstable hops
- Latency spikes
Check the NIC Itself
Sometimes the server is not running at the speed you think it is.
Check:
sudo ethtool eth0Look for:
Speed
Duplex
Auto-negotiation
Link detected
You may expect:
10000Mb/sonly to discover the interface negotiated at:
1000Mb/sThat immediately explains your benchmark limit.
Look for Network Errors
Run:
sudo ethtool -S eth0Filter suspicious counters:
sudo ethtool -S eth0 | grep -Ei "err|drop|miss|fault|crc"Possible problems include:
- RX drops
- TX drops
- CRC errors
- Missed packets
- Driver errors
You can also check:
ip -s link show eth0Check Whether Traffic Shaping Exists
A host or container may be intentionally limited.
Check:
tc qdisc showIf traffic shaping is configured, your benchmark may be measuring the configured limit rather than the physical network capability.
Watch Network Traffic Live
With ifstat:
ifstat -t 1Or:
sudo pktstat -i eth0These are useful while iperf3 is running because they show whether the expected interface is actually carrying the traffic.
Whole-System Stress Testing
Sometimes you are not interested in one specific subsystem.
You want to know:
Can this machine survive sustained heavy load?
stressapptest is useful for that:
sudo stressapptest \
    -s 600 \
    -M 4096
This runs for:
600 secondsand uses approximately:
4096 MiB RAMIt mixes CPU, memory, and I/O activity and can help expose unstable hardware.
A Longer Burn-In Test
For a newly installed physical server, a one-hour stress test is often more useful than a short benchmark.
For example:
sudo stress-ng \
    --cpu 0 \
    --vm 4 \
    --vm-bytes 70% \
    --timeout 1h \
    --metrics-brief
At the same time, monitor temperatures:
watch -n 1 sensorsAnd kernel messages:
sudo dmesg -wThings you do not want to see include:
Machine Check Exception
I/O error
NVMe error
memory error
thermal throttling
CPU lockup
Monitor the Server While Benchmarking
A benchmark number without system monitoring can be misleading.
Keep additional terminals open.
CPU usage:
mpstat -P ALL 1Memory and scheduling:
vmstat 1Storage:
iostat -xz 1Network:
ifstat -t 1Temperature:
watch -n 1 sensorsThis lets you understand why a benchmark produced a particular result.
Save the Results
A benchmark that disappears when you close the terminal is not very useful.
Create a results directory:
mkdir -p resultsCapture CPU results:
sysbench cpu \
    --cpu-max-prime=20000 \
    --threads=$(nproc) \
    run \
    | tee "results/sysbench_cpu_$(date +%F_%H-%M-%S).log"
Capture an fio test:
fio \
    --name=randrw \
    --filename=/mnt/testfile \
    --size=10G \
    --bs=64k \
    --rw=randrw \
    --rwmixread=70 \
    --ioengine=libaio \
    --direct=1 \
    --numjobs=4 \
    --runtime=120 \
    --time_based \
    --group_reporting \
    | tee "results/fio_$(date +%F_%H-%M-%S).log"
Capture network results:
iperf3 \
    -c server-ip \
    -P 4 \
    -t 120 \
    | tee "results/iperf3_$(date +%F_%H-%M-%S).log"
Save the Server Configuration Too
You should also save the environment that produced the benchmark.
{
    echo "=== DATE ==="
    date

    echo
    echo "=== KERNEL ==="
    uname -a

    echo
    echo "=== CPU ==="
    lscpu

    echo
    echo "=== MEMORY ==="
    free -h

    echo
    echo "=== STORAGE ==="
    lsblk -o NAME,SIZE,TYPE,FSTYPE,MOUNTPOINTS,MODEL
} | tee "results/system_$(date +%F_%H-%M-%S).log"
Months later, this information can be more valuable than the benchmark result itself.
What Should You Actually Compare?
Different benchmarks answer different questions.
CPU
Look at:
Single-thread events/sec
Multi-thread events/sec
CPU frequency during load
Temperature
Sustained performance
Memory
Look at:
MiB/sec
Operations/sec
Latency
Swap usage
Memory errors
Storage
Look at:
IOPS
MiB/s
Average latency
p95 latency
p99 latency
Queue depth
Device utilization
Network
Look at:
TCP throughput
UDP throughput
Packet loss
Jitter
RTT
NIC errors
Benchmarking Virtual Machines
Virtual machines introduce another layer of variables.
Two VMs with the same:
4 vCPU
8 GB RAM
can perform very differently depending on:
- Host CPU
- CPU model exposed to the guest
- Host oversubscription
- NUMA
- Storage backend
- Disk controller
- Ballooning
- Network adapter
- Hypervisor load
Check whether Linux is virtualized:
systemd-detect-virtAnd record:
lscpuIf you are comparing Proxmox/KVM VMs, the configured CPU type can significantly affect benchmark results.
Cloud Benchmarks Need Extra Context
Cloud providers often enforce limits that are not obvious from inside the guest OS.
Examples include:
- Burst CPU credits
- Shared CPU contention
- Network bandwidth caps
- Storage IOPS caps
- Storage throughput caps
- Burst disk performance
A benchmark that looks excellent once and poor ten minutes later may be hitting a burst limit.
Run the same test several times and preferably at different times before drawing conclusions.
A Practical New-Server Benchmark Routine
If I receive a new Linux server and want a quick baseline, I usually test it in this order.
First, capture hardware information:
lscpu
free -h
lsblk
ip addr
Then test CPU:
sysbench cpu \
    --cpu-max-prime=20000 \
    --threads=$(nproc) \
    run
Then memory:
sysbench memory \
    --threads=$(nproc) \
    --memory-block-size=1M \
    --memory-total-size=100G \
    run
Then storage:
fio \
    --name=randrw \
    --filename=/mnt/testfile \
    --size=10G \
    --bs=64k \
    --rw=randrw \
    --rwmixread=70 \
    --ioengine=libaio \
    --direct=1 \
    --numjobs=4 \
    --runtime=120 \
    --time_based \
    --group_reporting
Then network.
Server:
iperf3 -sClient:
iperf3 -c server-ip -P 4 -t 120Finally, run a stability test:
sudo stress-ng \
    --cpu 0 \
    --vm 4 \
    --vm-bytes 75% \
    --timeout 10m \
    --metrics-brief
That sequence gives a reasonably good first picture of the machine.
Cleaning Up After Testing
Remove temporary storage test files:
rm -f /mnt/testfileStop iperf3 with:
Ctrl+CCheck whether any stress processes remain:
pgrep -a stress-ng
pgrep -a stressapptest
Stop them if necessary:
sudo pkill stress-ngQuick Benchmarking Reference
| Area | Tool | What It Tells You |
|---|---|---|
| CPU | sysbench |
CPU throughput |
| CPU stress | stress-ng |
Stability and sustained CPU behavior |
| Crypto | openssl |
TLS/crypto performance |
| Memory | sysbench |
Memory throughput |
| RAM testing | memtester |
Memory stability |
| Storage | fio |
IOPS, bandwidth, latency |
| Quick disk test | dd |
Rough sequential throughput |
| Disk read | hdparm |
Basic buffered read performance |
| Disk monitoring | iostat |
Live disk latency and utilization |
| LAN | iperf3 |
Server-to-server bandwidth |
| Internet | speedtest-cli |
External WAN bandwidth |
| Latency | ping |
RTT and packet loss |
| Path quality | mtr |
Per-hop latency/loss |
| NIC | ethtool |
Link speed and NIC counters |
| Network monitor | ifstat |
Live bandwidth |
| System stress | stressapptest |
Combined hardware stress |
| Thermals | s-tui |
CPU temperature/frequency |
Final Thoughts
Benchmarking is most useful when you stop thinking about it as a race for the biggest number.
A good benchmark should help answer questions such as:
Why does this VM feel slower than the previous one?
Is the NVMe actually faster for my database workload?
Is the CPU throttling after ten minutes?
Can this network really sustain 10 Gbps?
Did a BIOS update or kernel upgrade reduce performance?
Is the new server genuinely faster, or does it only look faster on paper?
The tools in this guide give you the raw measurements, but the real value comes from keeping the tests consistent and recording the environment around them.
If you use the same commands, test duration, workload parameters, and monitoring process each time, you gradually build a performance history for your infrastructure.
That history is far more useful than a single impressive benchmark screenshot.